Introduction
Overview
This extension allows you to use familiar Python libraries for building graphics from datasets and add these to your very own app! The libraries supported are:
In this page we will cover how to add the extension to your project and a quick walkthrough of creating your very first plots.
Getting Started
Add your first Bokeh Component
Now that you are setup we can go ahead into adding our first Bokeh plot.
All you need is pass a figure to the imported Bokeh component. If you would like to learn more about creating figures read Bokeh's getting started docs.
As for how to use this with Dara, below is a full example of how this might look in an app:
from bokeh.plotting import figure

from dara.components import Bokeh, Stack
from dara.core import DerivedVariable, Variable, py_component, ConfigurationBuilder, get_icon, ComponentInstance

# config
config = ConfigurationBuilder()


def get_bokeh_figure(x, y):
    # creates a new figure for plotting
    fig = figure(title='First Bokeh Plot')

    # you can define further properties of the graph such as labels
    fig.xaxis.axis_label = 'Age (Years)'
    fig.yaxis.axis_label = 'Average Weight (kg)'

    # adds a line graph to the plot
    fig.line(x, y)

    return fig


# prepare some data
x = Variable([2, 3, 4, 5, 6, 7, 8])
y = Variable([12, 14, 15, 18, 20, 22, 26])

# we recommend adding your bokeh figure to a Derived Variable
# note that for this to work you MUST set cache to None
bokeh_figure = DerivedVariable(get_bokeh_figure, variables=[x, y], cache=None)


@py_component
def bokeh_page_content(figure) -> ComponentInstance:
    # pass figure into Bokeh component
    return Stack(Bokeh(figure))


config.add_page(name='My first Bokeh', content=bokeh_page_content(bokeh_figure), icon=get_icon('chart-line'))
If the figure is given in the form of a DerivedVariable as in the example above, its cache must be set to None.
This is so that the figure is re-created each time.
This comes from a requirement from Bokeh library itself, apps that use Bokeh follow a recipe which creates a collection of Bokeh objects which are automatically synced between Python/JS. Every time the recipe is used it must create a brand new collection of objects, this is so that there is no possibility for the recipe instructions to happen out of order.
A useful prop to set to your Bokeh figure is sizing_mode, this allows for the Bokeh plot to adapt its size based on the space available to it.
You can set it as follows:
from bokeh.plotting import figure

figure(sizing_mode='stretch_both')
Add your first Plotly Component
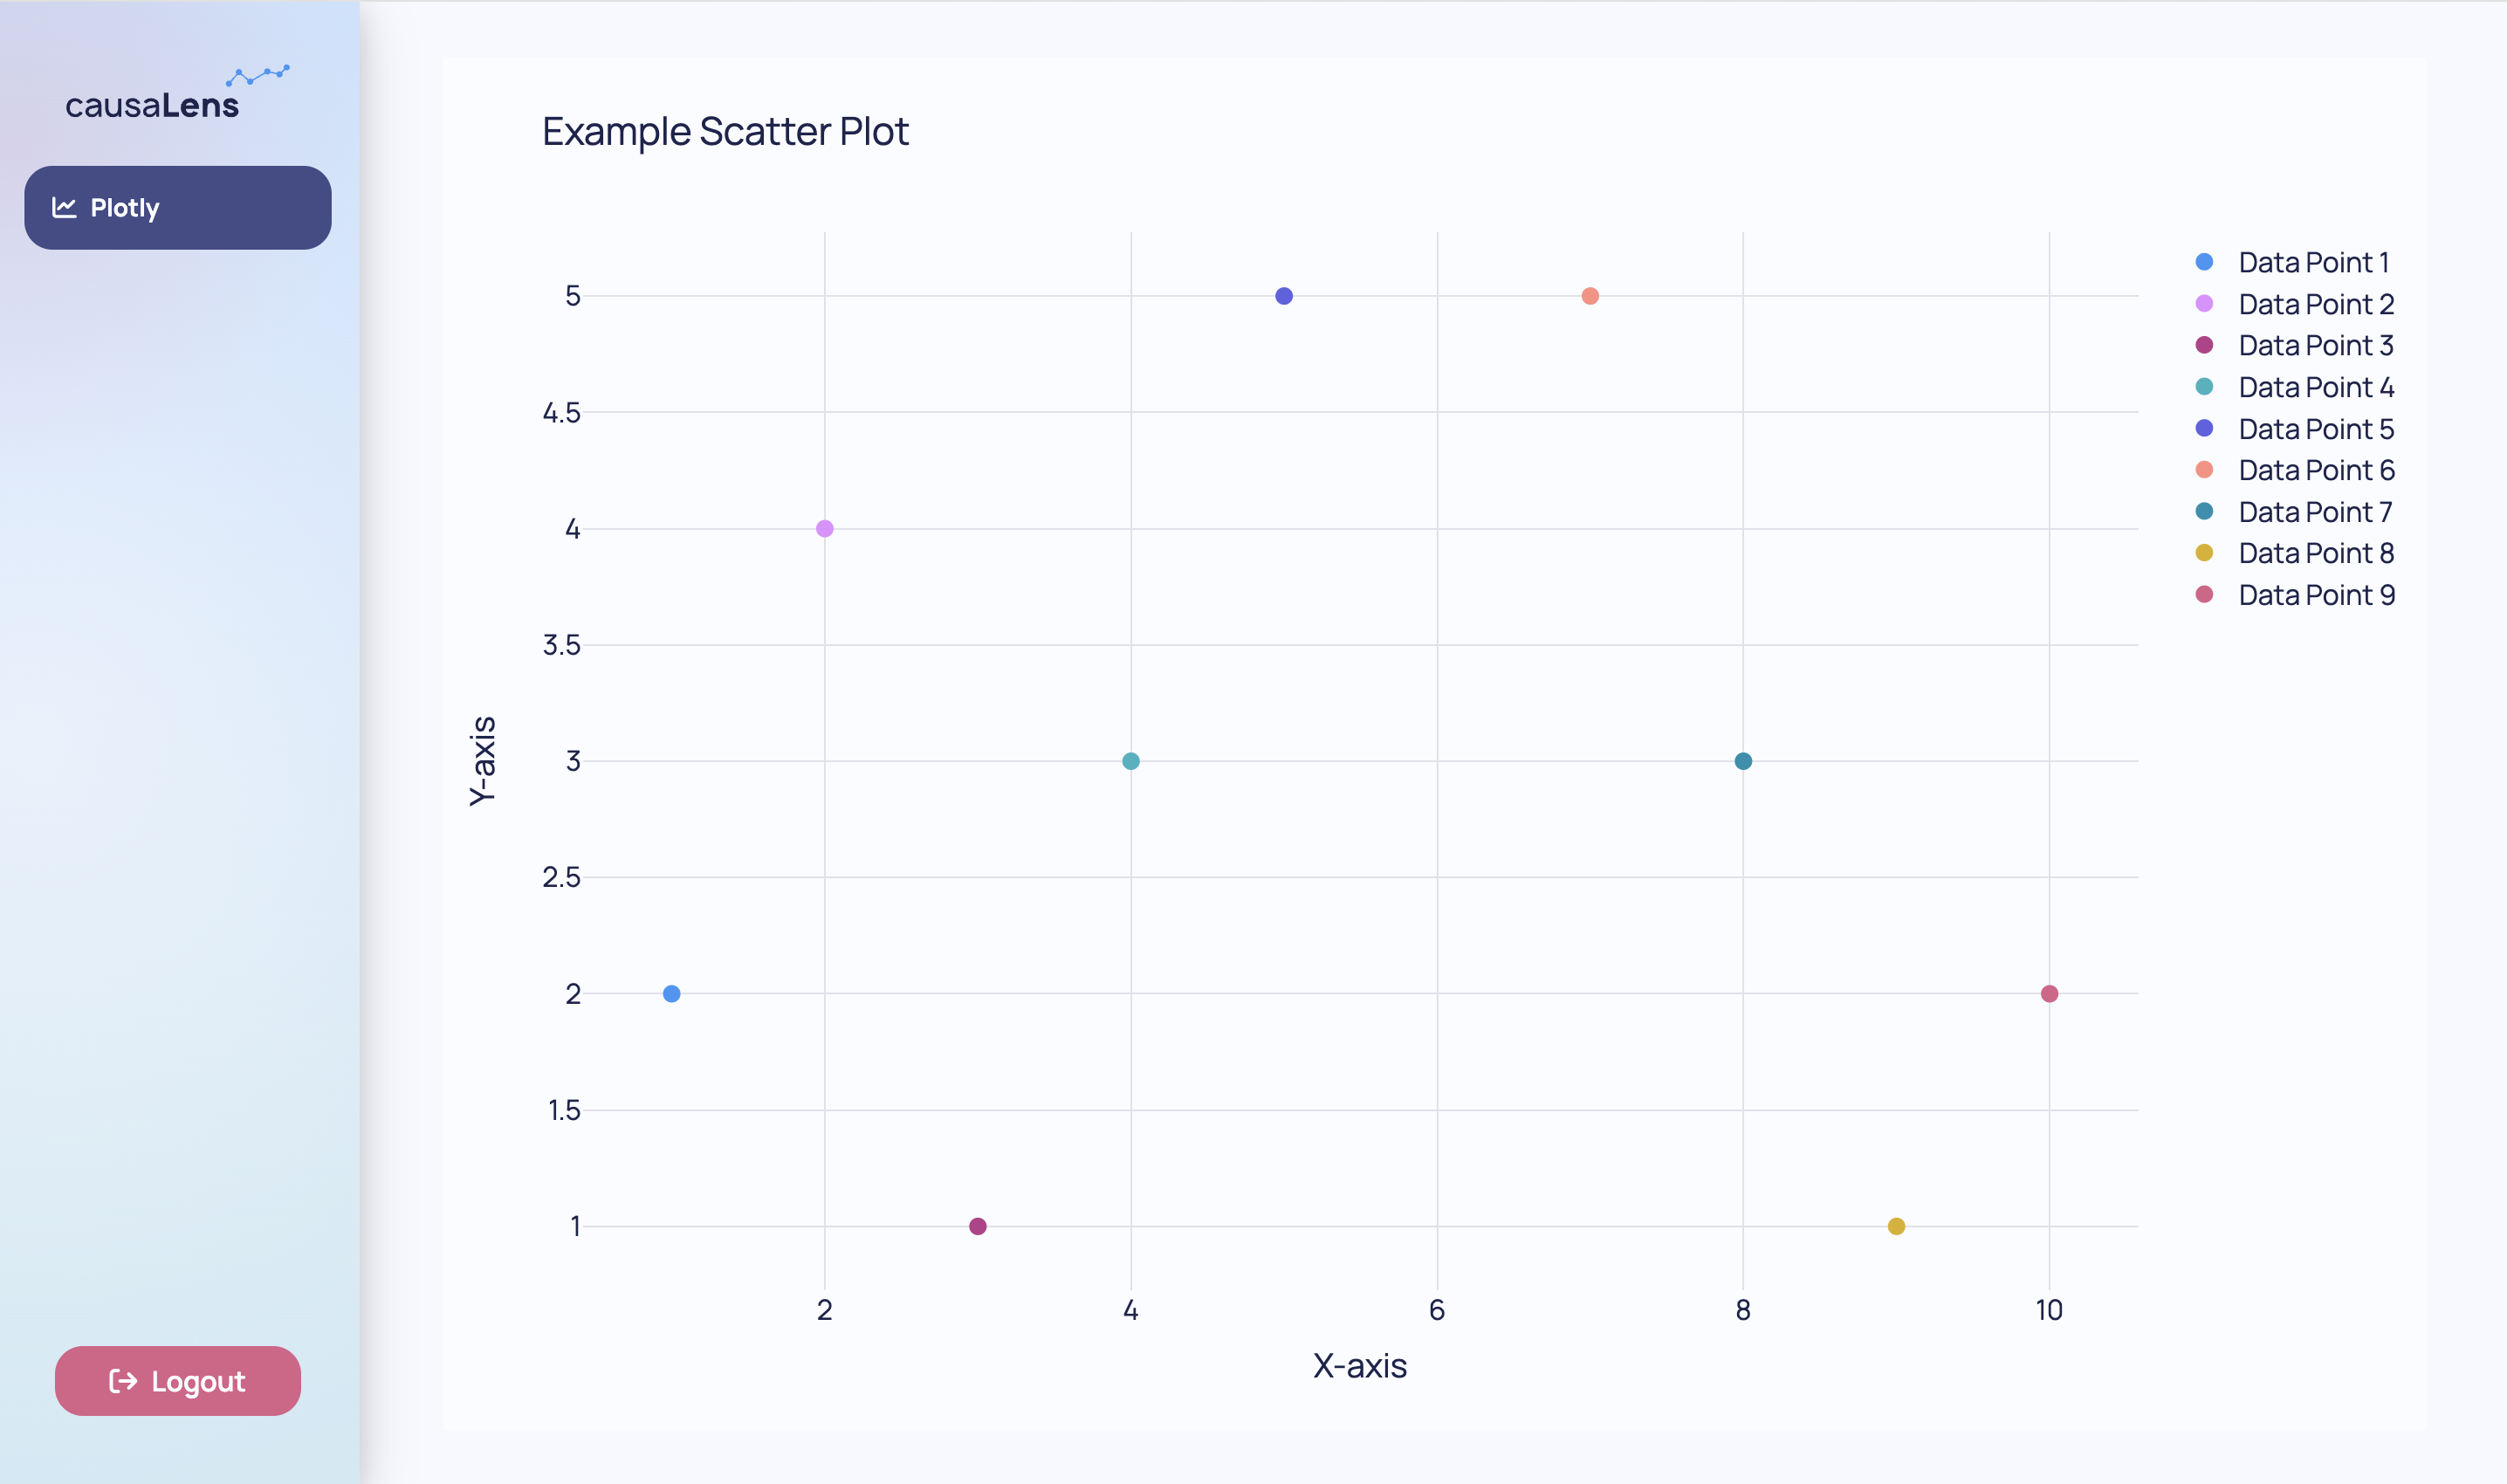
For Plotly all you need to do is pass a figure to the component. This component can be used for Plotly Express as well.
from dara.components import Plotly
from dara.core import ConfigurationBuilder, ComponentInstance, get_icon
import plotly.graph_objects as go

def get_plotly_figure():
    x = [1, 2, 3, 4, 5, 7, 8, 9, 10]
    y = [2, 4, 1, 3, 5, 5, 3, 1, 2]

    data = []
    for i in range(len(x)):
        trace = go.Scatter(x=[x[i]], y=[y[i]], mode='markers', name=f'Data Point {i+1}', marker=dict(size=10))
        data.append(trace)

    layout = go.Layout(title='Example Scatter Plot', xaxis=dict(title='X-axis'), yaxis=dict(title='Y-axis'))
    fig = go.Figure(data=data, layout=layout)

    return fig

def plotly_page_content() -> ComponentInstance:
    return Plotly(get_plotly_figure()),


config = ConfigurationBuilder()
config.add_page(name='Plotly', content=plotly_page_content(), icon=get_icon('chart-line'))
Add your first Matplotlib Component
To add a matplotlib or seaborn plot into your app, all you need to do is pass a matplotlib figure into the component. Since Seaborn is built on top of Matplotlib and uses the same figure class this component can be used for both libraries.
from dara.core import ConfigurationBuilder
from dara.components import Matplotlib

from matplotlib.figure import Figure
import seaborn as sns


def seaborn_example():

    # Create a Figure object
    fig = Figure(figsize=(8, 6))

    # Generate some sample data
    tips = sns.load_dataset('tips')

    # Add a subplot to the Figure
    ax = fig.add_subplot()

    # Create a scatter plot using Seaborn
    sns.scatterplot(data=tips, x='total_bill', y='tip', hue='time', style='time', ax=ax)

    # Customize the plot as needed
    ax.set_xlabel('Total Bill')
    ax.set_ylabel('Tip')
    ax.set_title('Scatter Plot with Figure')
    return Matplotlib(fig)


config = ConfigurationBuilder()
config.add_page(name='Matplotlib Component', content=seaborn_example())
Although matplotlib plots can usually be made with pyplot, this is not thread-safe and so should not be used. Instead, use the matplotlib figure object.
You should use:
from matplotlib.figure import Figure
Default theme
You can choose a default theme for all your plotting components using the following
from dara.components.plotting import set_default_bokeh_theme, set_default_plotly_theme

# provide theme object as expected by bokeh Document, see docs https://docs.bokeh.org/en/2.4.1/docs/reference/document.html#bokeh.document.Document.theme
set_default_bokeh_theme({ ... })

set_default_plotly_theme({ ... })
The set_default_bokeh_theme and set_default_plotly_theme takes a dictionary representation of the theme that each plotting library takes.
For example, you can use the following default Dara dark theme for Plotly:
import plotly.express as px
from dara.components import Plotly, set_default_plotly_theme
from dara.components.plotting.plotly import dark_theme


df = px.data.iris()  # Using built-in Iris dataset
fig = px.scatter(df, x='sepal_width', y='sepal_length', color='species', title='Iris Dataset Scatter Plot')


set_default_plotly_theme(theme=dark_theme)
Plotly(figure=fig, min_height=500)
You can also modify the default themes for each plotting library by modifying the theme dictionary. You can find the documentation for themes in the links below: