Plotting Palettes
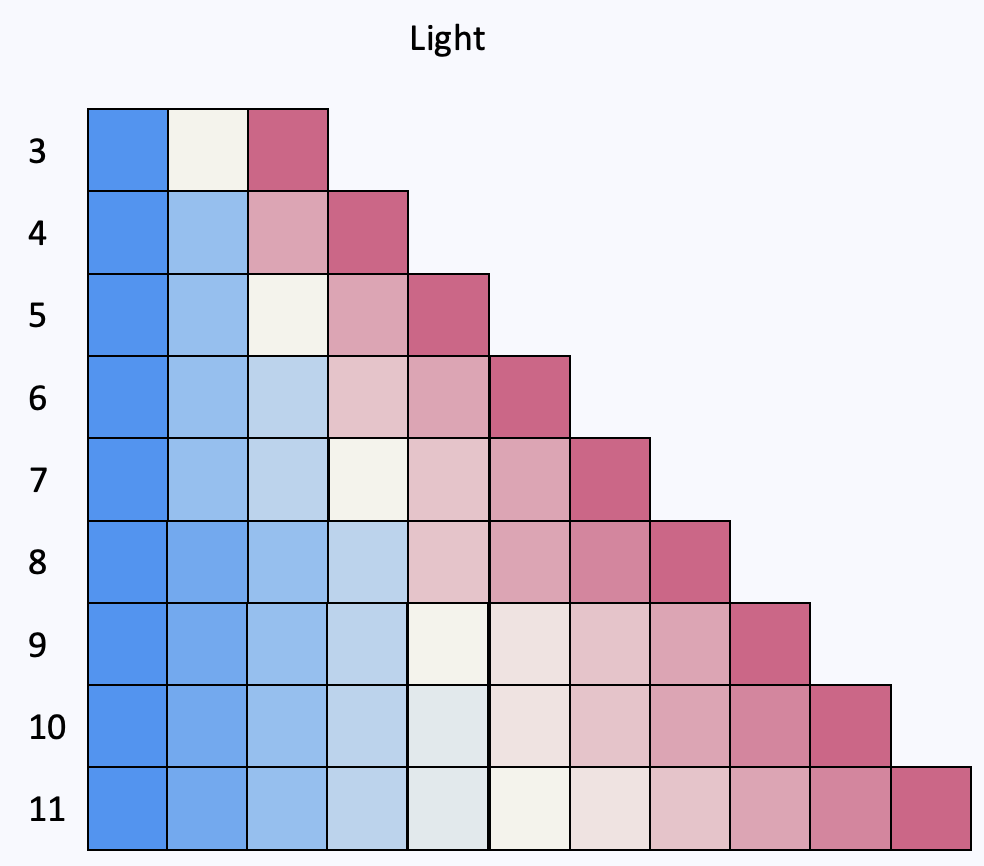
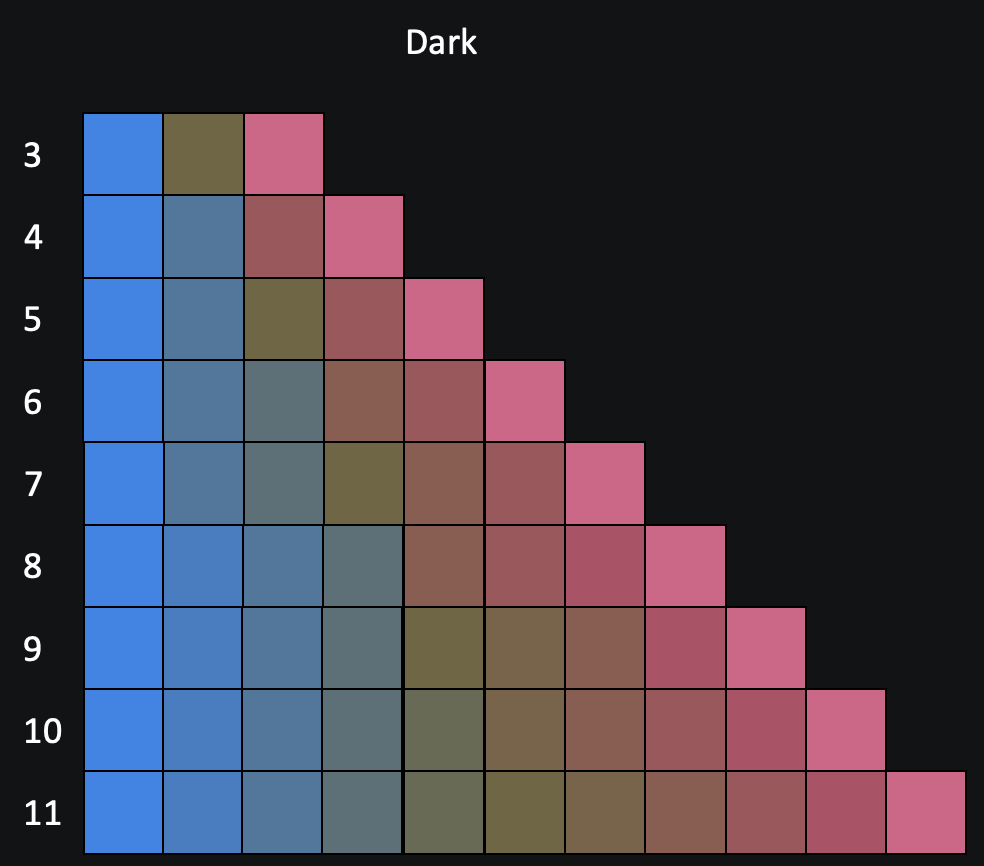
Dara offers the following 6 custom palettes to be used in your plots, these can be seen in more detail below:
| Light Theme Palettes | Dark Theme Palettes | Max number of colours available |
|---|---|---|
| CategoricalLight | CategoricalDark | 10 |
| SequentialLight | SequentialDark | 10 |
| PolarisingLight | PolarisingDark | 11 |
They can be used in the same way as any other palette from Bokeh
These can also be used in Plotly for example by setting the colorway or colorscale attributes.
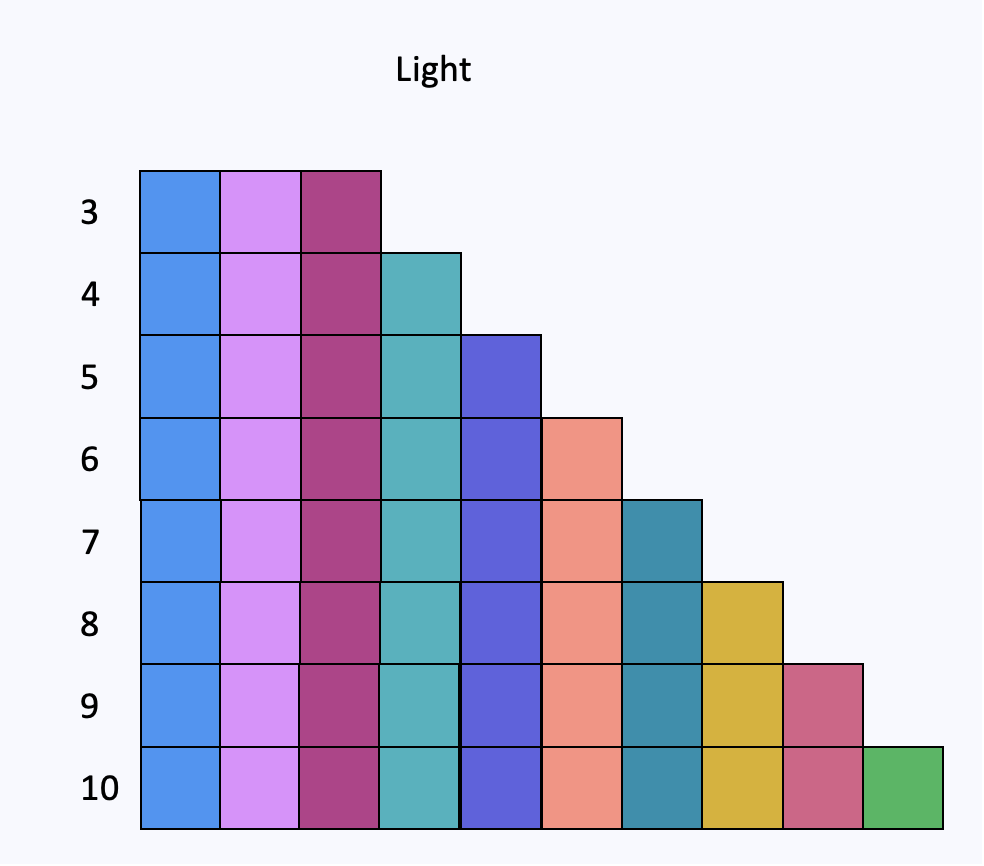
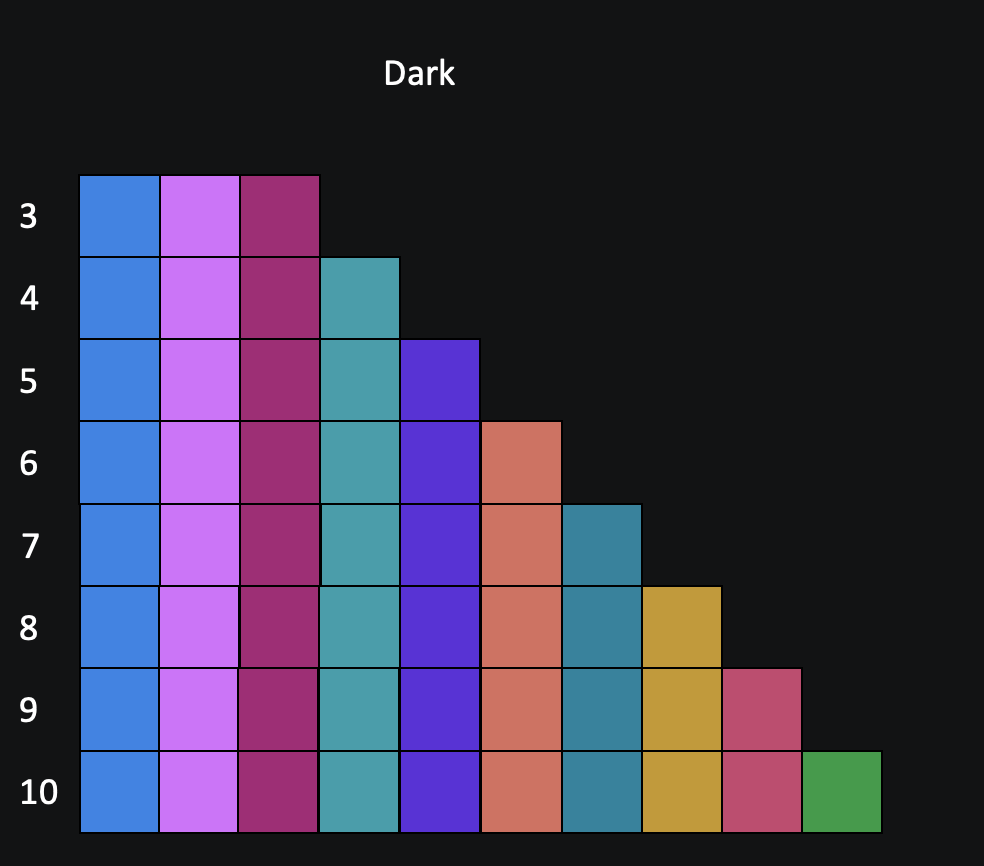
Categorical
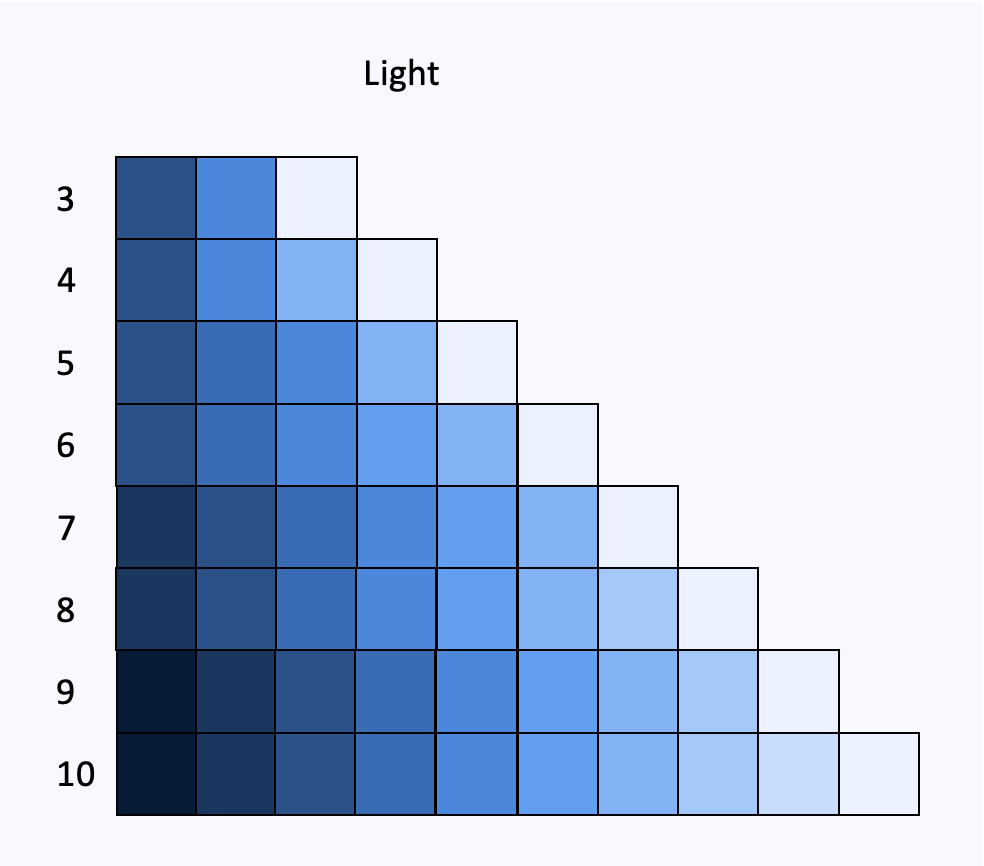
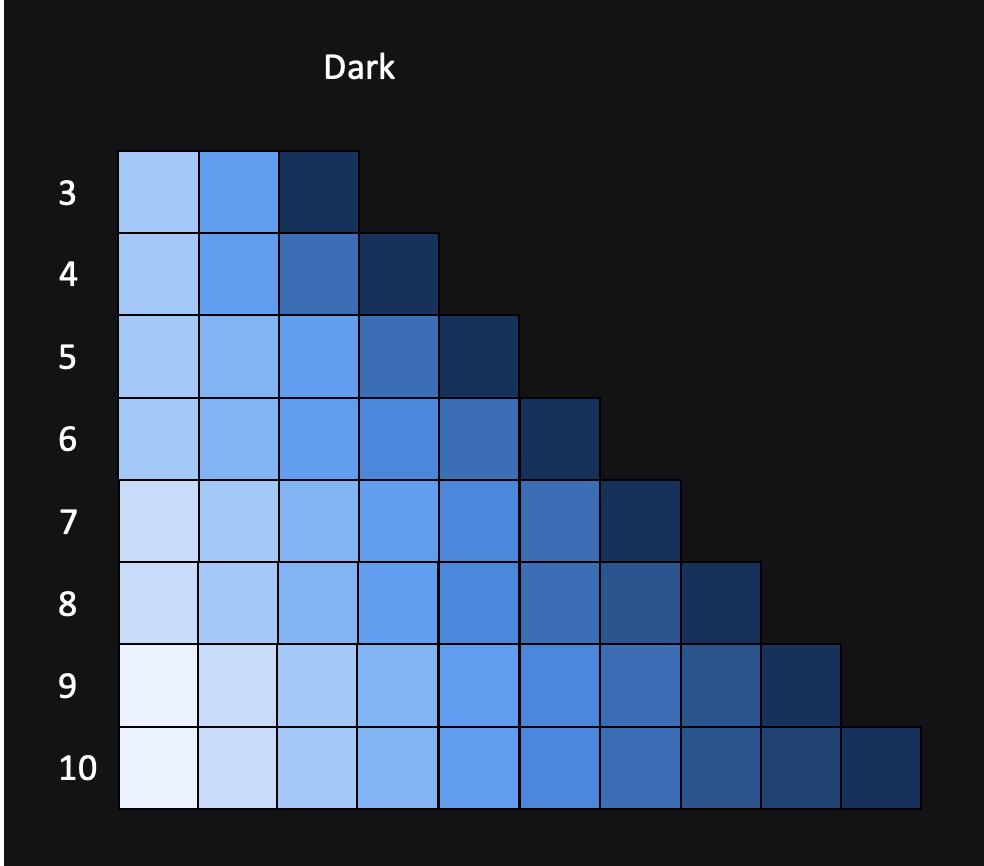
Sequential
Polarising
Example of using palette with Bokeh
An example app using such palette:
from bokeh.plotting import figure

from dara.core import ConfigurationBuilder, get_icon
from dara.components import Bokeh
from dara.components.plotting.palettes import PolarisingLight


def bokeh_plot():

    letters = ['a', 'b', 'c', 'd', 'e', 'f', 'g', 'h', 'i', 'j', 'k']
    p3 = figure(x_range=letters)
    p3.vbar(x=[1, 2, 3, 4, 5, 6, 7, 8, 9, 10, 11], top=[11] * 11, bottom=[10] * 11, width=1, color=PolarisingLight[11])

    return Bokeh(p3)


config = ConfigurationBuilder()
config.add_page(name='Bokeh Example', content=bokeh_plot(), icon=get_icon('palette'))
Example of using palette with Plotly
An example app using Sequential Palette:
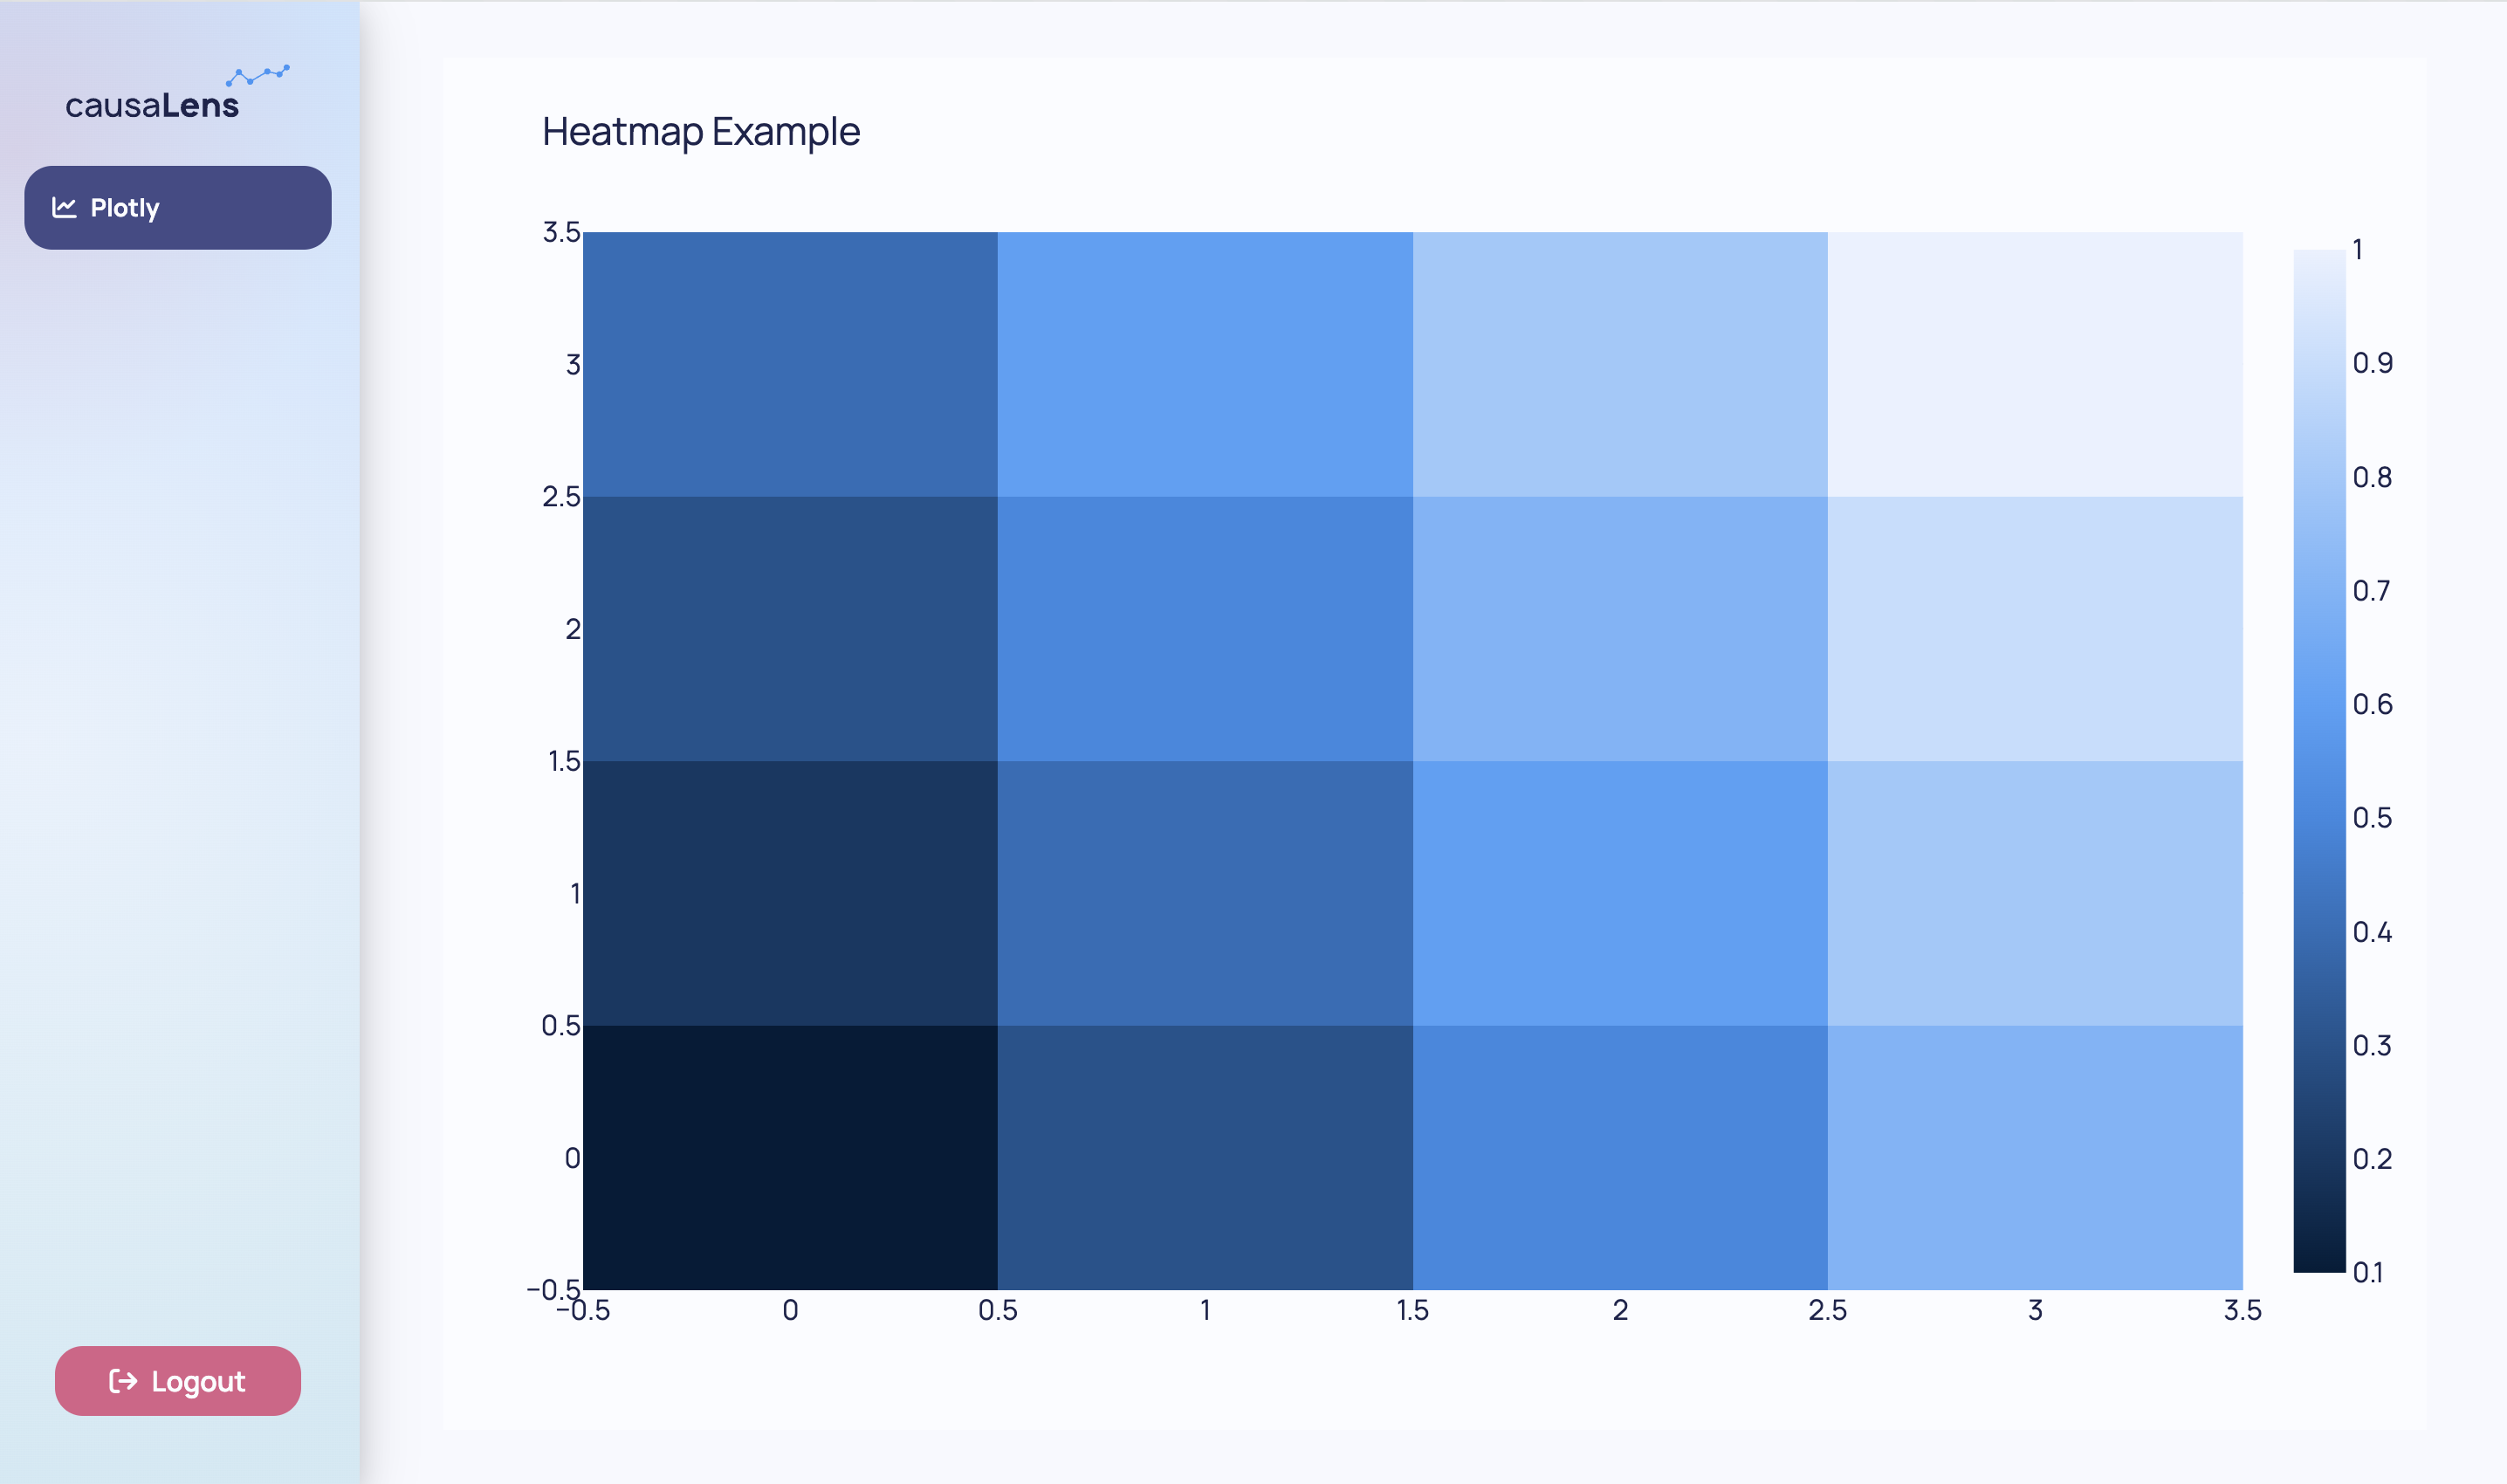
import plotly.graph_objects as go

from dara.components import Plotly
from dara.components.plotting.palettes import SequentialLight10

from dara.core import ConfigurationBuilder, ComponentInstance, get_icon

def heatmap_example():
    # Sample data
    z = [[0.1, 0.3, 0.5, 0.7], [0.2, 0.4, 0.6, 0.8], [0.3, 0.5, 0.7, 0.9], [0.4, 0.6, 0.8, 1.0]]

    # converts sequential palette into a colorscale for heatmap
    colorscale = []
    num_colors = len(SequentialLight10)

    for i in range(num_colors):
        color = SequentialLight10[i]
        position = i / (num_colors - 1)
        colorscale.append([position, color])

    # Define the heatmap trace
    heatmap = go.Heatmap(z=z, colorscale=colorscale)

    # Create the figure
    fig = go.Figure(data=heatmap)

    # Set the plot title
    fig.update_layout(title='Heatmap Example')

    return Plotly(fig)

config = ConfigurationBuilder()
config.add_page(name='Plotly Example', content=heatmap_example(), icon=get_icon('palette'))